Feature
Interactive
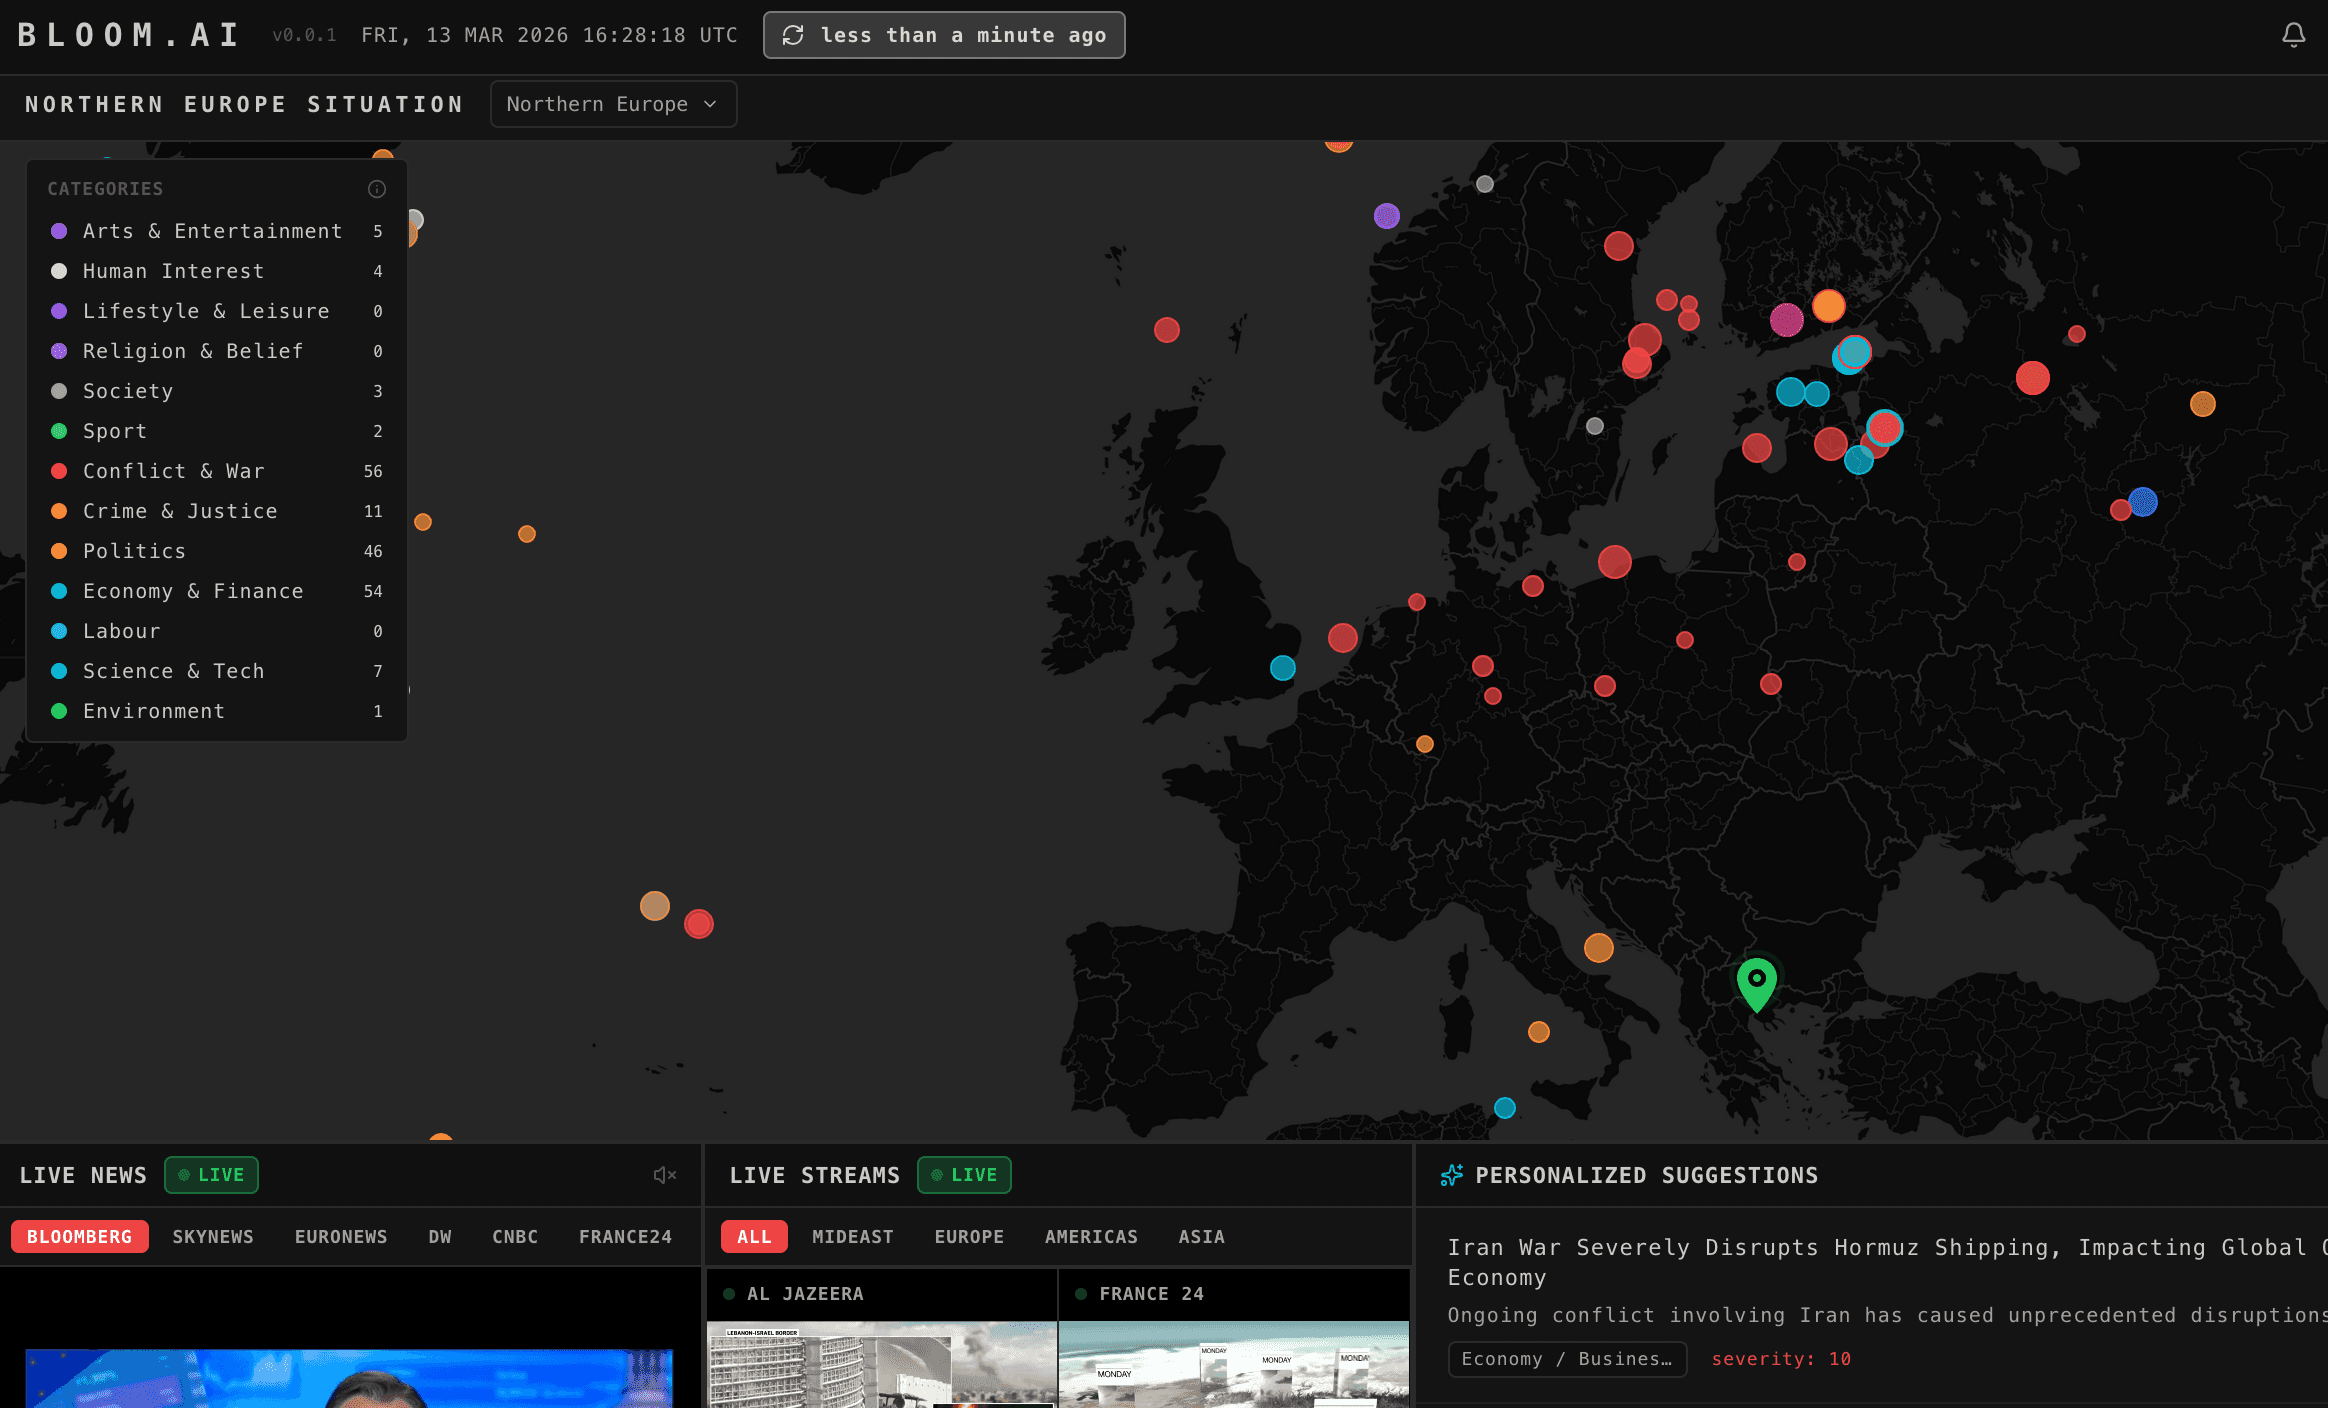
Map
See where things are happening, how severe they are, and what sources are reporting - all on a single, real-time map. Every event is geocoded and pinned to its exact location.
From correlated events
to geographic context
Geocode
Each unified event is assigned latitude and longitude from region data, entity extraction, and source metadata.
Classify
Events carry AI-generated categories and severity scores that determine pin appearance and filtering behavior.
Render
Pins are placed on the map with color and size encoding severity - high-impact events are immediately visible.
Interact
Click any pin to reveal the full event context, source articles, severity breakdown, and related events.
Visual encoding
Severity at a glance
Map pins encode severity through both color and size. Critical events stand out immediately while lower-severity pins provide context without visual clutter. The severity score is computed by AI during classification and represents the assessed global impact of each event.
- Color intensity scales with event severity
- Pin size reflects relative impact level
- Hover reveals severity score and category
- Cluster indicators for dense regions
Major armed conflicts, large-scale crises, and events with immediate global consequences.
Significant political events, economic disruptions, and escalating regional tensions.
Notable developments, policy changes, and events requiring monitoring.
Routine updates, minor incidents, and background context events.
EU Sanctions Package Triggers Market Reaction
New sanctions on energy exports cause European stock selloffs and crypto volume spikes in affected regions.
Contributing sources
Full context
Click any pin,
see everything
Every map pin represents a unified event built from multiple sources. Clicking reveals the AI-synthesized title and description, category tags, severity score, and direct links to every contributing source article. You see the complete picture without leaving the map.
- AI-synthesized event title and description
- Category and severity breakdown
- Links to all contributing raw events
- Original source article access
- Related event suggestions
Capabilities
Everything that powers the interactive map.
Geocoded events
Each aggregated event is geocoded with latitude and longitude derived from region data and entity extraction, placing it precisely on the map.
Region filtering
Filter the map by geographic region to focus on specific areas - from a global overview down to continent and country-level detail.
Cross-source context
Each pin represents a correlated event linking news articles, market data, and geopolitical signals into a single geographic point.
User location
The map detects and highlights your geographic area, making it easy to monitor events in your region alongside global developments.
Zoom controls
Smooth zoom from global overview to street level. Pin density adjusts dynamically so the map stays readable at every scale.
Real-time updates
The map reflects the latest pipeline output. As new events are ingested and correlated, pins appear and update automatically.
The world, at a glance
Explore global events visually - from breaking crises to emerging patterns, all mapped in real time.